Sunday also saw the conclusion of the fantasy football season with the Premier League's official game going right down to the wire. Being something of a fantasy football nut myself (and inspired by a question from a friend) I got wondering about how the Premier League table might have looked if it was fantasy, rather than real, points that counted.
In case you're unfamiliar with the wonderful time sink that is fantasy football all you need to know is that (real) footballers score (fantasy) points for various achievements on the pitch. How many points they get depends on their position but as a rule doing things that are good for your team (scoring goals or keeping clean sheets) earn you points while things that are bad for your team (getting booked pr conceding lots of goals) lose you points. Obviously there's rather more to it than that, but those are the basic principles.
It seems reasonable, then, that fantasy points should match up pretty well to real points. To see quite how well I ran the numbers: for every team in the Premier League I totalled up the fantasy points scored by all their players. (The only slight complication was that some players changed club partway through the season, but this only affected a handful of individuals who I dealt with manually.)
Here's how the fantasy table worked out, complete with the ranking differences between this and the real Premier League table. Teams in green gained places in the fantasy world, teams in dropped down, and teams in blue stayed the same (click for big).
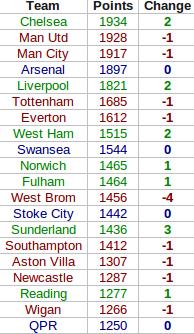
In the fantasy world Chelsea leapfrog both Manchester clubs to take top spot. This seems mainly down to where their goals came from. In this fantasy game a player gets more points for scoring a goal if they're a midfielder than if they're a striker. United's goals mainly came from Wayne Rooney and Robin van Persie - their forwards - while Chelsea profited much more from their midfield with a bulk of their goals coming from Juan Mata, Eden Hazard and, of course, Frank Lampard.
Elsewhere in the table there's not much movement, with only West Brom's fall of four places and Sunderland's rise of three standing out. The reasons for these are less clear (although one should bear in mind how tight the real Premier League table was in these areas), but West Brom did keep relatively few, and Sunderland relatively many, clean sheets.
As a final experiment (and to make this a little bit more statsy) I thought I'd see how well we could estimate a team's fantasy total based just on how many goals they scored and how many times they kept a clean sheet. Fitting a linear model suggested the following equation for estimating fantasy points for a team based solely on these two pieces of information:
Fantasy Points = 718 + 9G + 34C
where G stands for 'goals scored' and C for 'clean sheets kept'. In other words, with this very simple model (which nevertheless explains 97% of the variation in teams' fantasy scores) we find that the average goal is worth nine points, and the average clean sheet is worth 34. (The 718 at the front, meanwhile, is largely down to the fact that players usually earn two points simply for playing the match.)
There's not much more to say that doesn't involve devolving into a rather ludicrous level of fantasy football geekery, so I think I'll leave it at that. Now to work out what to do for the next two football-free months...

This is an awesome post. Really very informative and creative. I like it very much. This sharing concept is a good way to enhance the knowledge pool about football. Thank you very much for this post.
ReplyDeletepremier league live